Please note: Travis County's fiscal year starts on October.
As of March 31st, 2026
Portfolio Holdings Distribution by Maturity Range
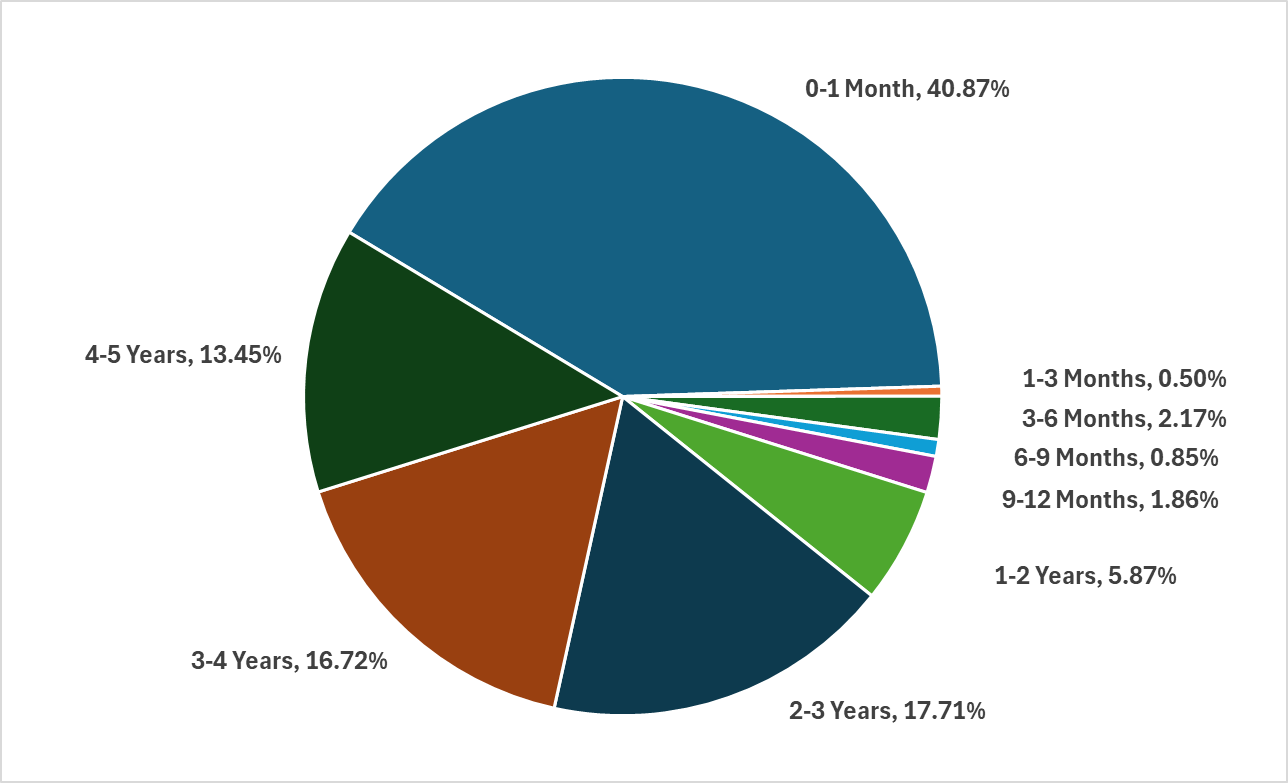
Table 2026 Q2-1: Portfolio Holdings Distribution by Maturity Range as of March 31th, 2026
| Maturity Range | Face Amount/Shares | % of Portfolio |
|---|---|---|
| 0-1 Month | 961,397,100.66 | 14.48% |
| 1-3 Months | 11,800,118.00 | 2.07% |
| 3-6 Months | 51,143,310.00 | 3.45% |
| 6-9 Months | 20,018,410.00 | 1.38% |
| 9-12 Months | 43,688,817.00 | 2.76% |
| 1-2 Years | 138,123,638.75 | 11.72% |
| 2-3 Years | 416,642,093.75 | 26.90% |
| 3-4 Years | 393,286,862.94 | 20.69% |
| 4-5 Years | 316,286,845.70 | 16.55% |
| Total | 2,352,387,196.80 | 100.00% |
Portfolio Holdings Distribution by Security Type
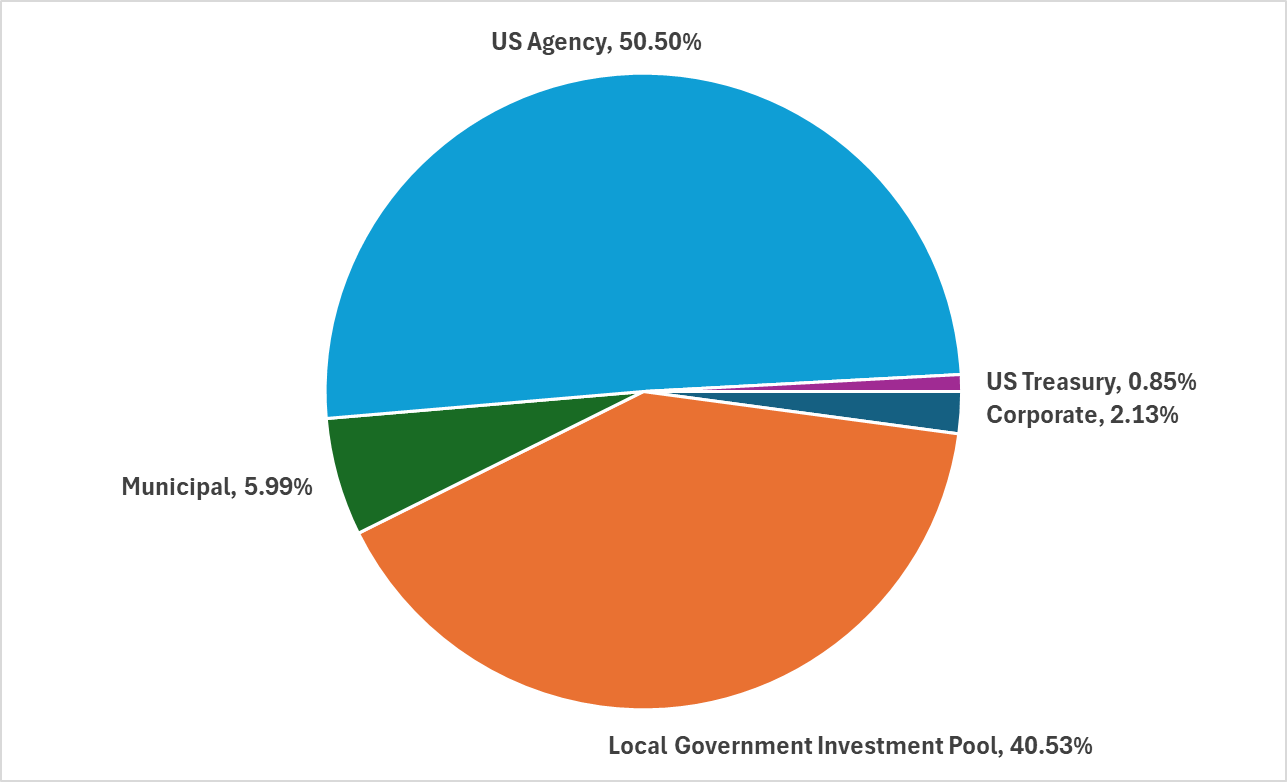
Table 2026 Q2-2: Portfolio Holdings Distribution by Security Type as of March 31th, 2026
| Security Type | Face Amount/Shares | % of Portfolio |
|---|---|---|
| Corporate | 50,000,000.00 | 2.13% |
| Local Government Investment Pool | 953,396,868.66 | 40.53% |
| Municipal | 140,970,794.10 | 5.99% |
| US Agency | 1,187,969,484.04 | 50.50% |
| US Treasury | 20,050,050.00 | 0.85% |
| Total | 2,352,387,196.80 | 100.00% |
Please note. The Travis County investment portfolio presented includes the Operating, Pooled Bond, Interest and Sinking, and CARES funds.
